This summer has been one for the record books. Communities across the nation have faced unprecedented rain levels and powerful storms. Even regions that rarely see high water are experiencing sudden flash floods.
These events show that flooding isn’t limited to coastal areas. It can happen almost anywhere, often when you least expect it. This makes understanding your property’s vulnerability more urgent than ever.
Outdated flood maps no longer show the true picture. Changing weather patterns and urban development have transformed previously safe zones. What was once a low-risk area can now be a potential problem spot.
This guide provides practical tools and step-by-step methods. You will learn how to assess your land accurately. We cover everything from elevation and drainage patterns to local factors.
Taking proactive steps now can save thousands of dollars in potential damage. It also provides peace of mind for your family or business before the next storm arrives.
Understanding Flood Risk and Drainage Challenges
Recent weather patterns have rewritten the rules about where water can accumulate. What was once considered safe ground may now face unexpected challenges during heavy rainfall.
Defining Flood Risk in Today’s Changing Climate
Flood risk simply means the chance that water will reach and potentially harm your property. This can happen during extreme rain, sudden storms, or when nearby waterways overflow.
Climate change has created more intense weather events. Areas that never had water issues before now experience pooling and flow problems. Historical data becomes less reliable for predicting future events.
Property owners should understand these main types of water accumulation:
- Flash events from heavy rainfall
- River overflow from waterways
- Coastal issues from storm surge
- Urban accumulation from overwhelmed systems
The Role of Drainage in Preventing Flood Damage
Proper water management systems can redirect flow away from structures. Even during extreme weather, good drainage makes a significant difference.
Poor systems cause localized pooling in low spots. Water naturally follows historical pathways and topography. Modern development with pavement and buildings reduces ground absorption.
Understanding both probability and drainage capacity is essential. Comprehensive flood risk management strategies combine these elements for better property protection.
Essential Tools and Resources for Flood Mapping
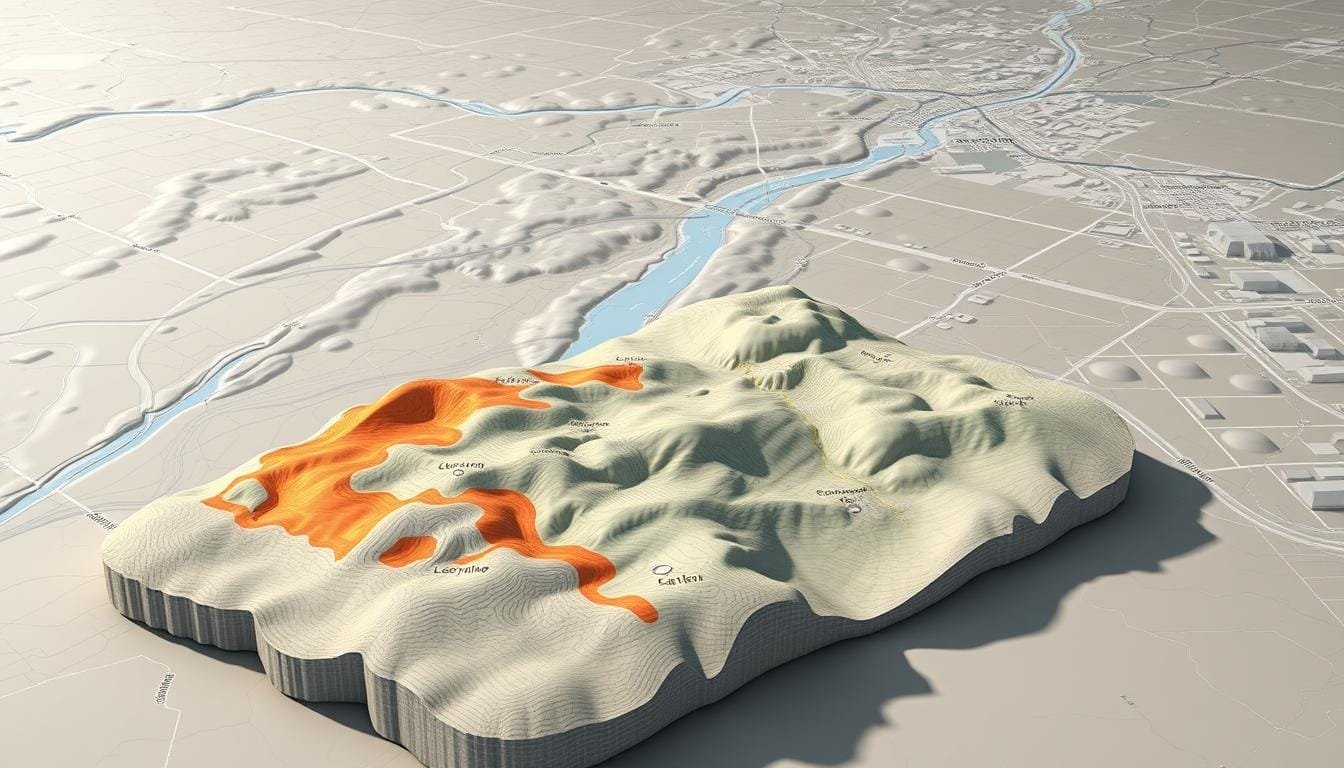
Digital mapping advancements have transformed how we assess property vulnerability to water events. Modern homeowners can access multiple resources to understand their exposure.
 software interface. In the middle ground, a collection of printed flood hazard maps, elevation data, and rainfall records. In the background, a subtly rendered landscape with contour lines, river networks, and shaded terrain. Warm lighting from the left casts a natural glow, creating depth and emphasizing the analytical nature of the tools. The overall composition conveys the comprehensive nature of flood mapping and the diverse data sources required for effective flood risk analysis.")
The Federal Emergency Management Agency provides the traditional starting point through their Flood Map Service Center. This official resource offers zone designations that influence insurance requirements.
Utilizing FEMA Flood Map Service Center
Visit msc.fema.gov and enter your address in the search tool. The interactive display shows your property’s classification and historical flood boundaries.
These maps indicate 1-in-100-year and 1-in-500-year event areas. However, significant limitations exist with this federal emergency management data.
Many maps remain outdated—sometimes decades old. Local governments sometimes resist updates fearing property value impacts. The management agency maps also exclude climate change factors.
| Mapping Resource | Data Sources | Key Features | Limitations |
|---|---|---|---|
| FEMA Map Service Center | Historical flood data | Official zone designations | Outdated information |
| Third-Party Tools | Recent rainfall data | Climate projections | Non-governmental source |
| Regional Applications | Local drainage patterns | Urban flood analysis | Limited availability |
Exploring Third-Party Mapping Tools and Data
Supplemental resources like Risk Factor and ClimateCheck provide current assessments. These tools incorporate recent weather statistics and drainage issues.
First Street Foundation analysis reveals properties face 2.2 times greater likelihood than FEMA indicates. Third-party data often includes pluvial flooding from poor urban drainage.
Using multiple mapping resources creates a comprehensive picture. Combine official designations with modern analytics for complete understanding.
Using Online Elevation Tools to Assess Your Property
Your property’s elevation is one of the most critical factors in determining its susceptibility to water accumulation. This height above sea level directly influences how easily water can reach your home.
Lower elevations face greater vulnerability during storms. Insurance providers use official Elevation Certificates to gauge this vulnerability. Higher ground often means lower premiums.
Overview of USGS National Map Viewer
The USGS National Map Viewer is a fantastic free resource. Visit the website and enter your address. Select the elevation tool icon and click on your property.
You will instantly see a spot elevation number. This number represents feet above sea level. A home at 10 feet is far more exposed than one at 50 feet.
How NOAA Sea Level Rise Viewer Enhances Your Analysis
For coastal homes, the NOAA Sea Level Rise Viewer is essential. It projects future sea level rise scenarios. You can visualize how different water level increases might affect your area.
This level rise viewer shows which zones could face regular tidal flooding in coming decades. It provides a forward-looking perspective that static maps lack.
Remember, these online tools offer estimates. For official purposes, like insurance, a licensed surveyor provides a precise Elevation Certificate.
check land for drainage and flood risk: A Step-by-Step Assessment
Building a comprehensive understanding of your property’s water exposure starts with foundational documents. This systematic approach ensures you gather all necessary information before making important decisions.

The process involves two main phases: collecting existing documentation and interpreting official classifications. Each step builds upon the previous one for a complete picture.
Gathering Property Records and Survey Information
Begin by locating your property survey and title documents. These papers often contain valuable elevation data and topographical details.
Your survey might show your property’s height above sea level. This information is crucial for understanding water flow patterns. Review boundary information and any noted drainage features.
Look for previous inspection reports in your files. These documents can reveal past water issues or signs of poor water management that current owners should address.
Interpreting Flood Zone Classifications
Visit FEMA’s Flood Map Service Center at msc.fema.gov. Enter your address to see your property’s official zone designation.
Zone X indicates lower probability areas. Zone AE shows higher probability with a 1% annual chance event. Zone VE applies to coastal properties with wave action concerns.
Remember that many maps contain outdated information. Combine this data with your property survey for the most accurate assessment of true water exposure.
Evaluating Flood Zone Classifications and Insurance Implications
The connection between FEMA’s flood zone classifications and insurance requirements directly impacts homeowners. Understanding these designations helps you make smart financial decisions about property protection.
Understanding FEMA’s Flood Zone Designations
FEMA uses specific codes to categorize property vulnerability. Zone X indicates minimal exposure, while Zone AE represents areas with 1% annual chance events.
Coastal properties face Zone VE designations with wave action concerns. Each classification carries different implications for safety and financial planning.
How Flood Insurance Requirements Are Determined
Properties in high-hazard zones typically require coverage through the National Flood Insurance Program. Lenders mandate this protection for federally backed mortgages in special hazard areas.
The statistical reality is eye-opening. A property in a 1-in-100-year zone has approximately 26% chance of experiencing water damage during a standard 30-year mortgage period.
Even moderate-risk areas should consider protection. Over 20% of claims originate from properties outside high-hazard zones. Premiums depend on multiple factors including elevation and building construction.
Remember there’s a 30-day waiting period before policies take effect. Planning ahead provides crucial protection before storm seasons arrive.
Local Factors Impacting Drainage and Flood Severity
Your property’s immediate surroundings often tell a more accurate story than official flood zone maps. Even homes at similar elevations can experience dramatically different water exposure based on neighborhood-specific conditions.
Site-specific assessment becomes critical when you consider how development patterns affect water movement. Natural topography continues to influence flow paths regardless of construction above ground.
Influence of Stormwater Drainage on Flood Events
Municipal drainage systems play a crucial role during heavy rainfall. Storm sewers, catch basins, and drainage pipes work together to manage runoff from paved surfaces.
When these systems become overwhelmed or clogged, urban flooding occurs. Water backs up from storm drains, creating localized events far from rivers or coasts.

The concept of a 100-year storm represents a rainfall event with 1% annual probability. Despite the statistical name, these intense storms can occur multiple times within just a few years.
San Francisco’s experience demonstrates how historical development affects modern flooding. Natural creeks and wetlands were covered by pavement, yet stormwater still follows those underground paths during extreme weather.
| Local Factor | Impact Level | Investigation Method | Prevention Strategy |
|---|---|---|---|
| Storm Drain Condition | High | Visual inspection | Regular maintenance |
| Drainage Pipe Capacity | Critical | Municipal records | Infrastructure upgrades |
| Historical Waterways | Moderate-High | Local maps | Proper grading |
| Neighborhood Flood History | Informative | Community records | Early warning systems |
Significant flooding means water at least 6 inches deep covering half a city block. This depth causes substantial property damage and safety hazards.
Contact your local public works department to learn about drainage infrastructure serving your property. They can provide information about planned improvements and how to report issues before they cause problems.
Advanced Data and Tools for In-Depth Flood Analysis
Today’s property owners have access to sophisticated analysis tools that go far beyond traditional flood maps. These resources incorporate climate projections and multiple water sources for forward-looking assessments.
Leveraging Federal Emergency Management Data
The First Street Foundation’s Risk Factor tool provides comprehensive property-specific ratings. Enter any address to receive a flood risk score from 1-10 for the next 30 years.
This evaluation considers rainfall accumulation, river overflow, tidal issues, and coastal storm surge. The methodology uses updated rainfall statistics and climate projections.
For deeper historical context, consider using LiDAR data alongside these tools. This combination provides enhanced topographical understanding.
Integrating Climate Risk Tools into Your Evaluation
ClimateCheck offers alternative ratings on a 1-100 scale relative to other U.S. properties. It provides separate scores for different water sources and additional climate hazards.
Specialized sea level rise tools from NOAA and EPA allow coastal owners to visualize future impacts. These resources show how different water level increases create new vulnerable areas.
While these tools provide valuable awareness, they shouldn’t replace detailed site-specific studies for critical decisions. Understanding each tool’s limitations ensures proper interpretation.
Real-World Case Studies and Property Flood Experiences
Case studies from affected communities highlight the gap between official maps and reality. These examples show how water threats have evolved beyond traditional expectations.
Examples from U.S. Communities Facing Urban Flooding
Houston’s Harris County demonstrates this disconnect clearly. What FEMA calls a 100-year storm now occurs approximately every 13 years according to updated analysis.
The Memorial Day 2015, Tax Day 2016, and Hurricane Harvey events struck within just a few years. San Francisco developed detailed maps showing parcels facing deep water during extreme storms.

Coastal towns in Florida and Louisiana face increasing issues from storm surge. Many buildings have become repetitive loss properties due to multiple incidents.
Key Learnings from Historical Flood Events
Over 20% of insurance claims originate outside high-hazard zones. This shows that low-risk designations don’t mean no exposure.
More than one-third of states lack disclosure requirements for previous water damage. Buyers may unknowingly purchase vulnerable properties.
Practical lessons include researching actual history before buying. Consider protection even in moderate-risk areas. Prepare for events that exceed historical norms.
Final Steps for Safeguarding Your Property Against Flooding
Protecting your home from water damage requires ongoing attention and smart preparation. You now have the knowledge to understand your property’s unique situation.
This guide walked you through reviewing zone designations, finding your elevation, and analyzing local factors. These steps create a complete picture of your exposure.
If your findings are concerning, take action now. Consider a professional assessment for tailored advice. Install barriers for vulnerable entry points. Keep gutters and downspouts clear to direct flow away from your foundation.
Develop an emergency plan for your family or business. This includes knowing evacuation routes and having supplies ready.
Insurance provides crucial financial safety, even in moderate-risk zones. Contact an agent to explore your options. Remember, proactive measures offer peace of mind and can prevent significant loss.