Did you know a 1-meter error in elevation data can cause a 100 km² mistake in flood estimates? This shows how vital accurate elevation mapping is for managing flood risks. LiDAR technology is a big help in this area.
LiDAR, short for Light Detection and Ranging, has changed how we collect and analyze topographic data for flood risk. It gives us very accurate elevation info. This makes it a top choice for flood risk experts in the U.S.
The Federal Emergency Management Agency (FEMA) sees LiDAR’s value in flood risk assessment. Through its Risk Mapping, Assessment, and Planning (Risk MAP) Program, FEMA has set clear LiDAR data quality standards. This shows how important LiDAR is for making flood risk policies.
LiDAR’s ability to map elevations is unmatched. It can gather data at up to 50 km² per hour, saving time and money. This detail is key for cities, where small features like road curbs can affect flood simulations.
As we explore LiDAR and its role in flood risk assessment, you’ll see how it’s changing our flood prevention and management methods. Keep reading to learn more about using LiDAR for safer, more resilient communities.
Understanding LiDAR Technology
LiDAR technology has changed how we map and analyze our world. This laser scanning technique creates detailed 3D models of terrain and objects. It offers unmatched accuracy in collecting geospatial data.
What is LiDAR?
LiDAR stands for Light Detection and Ranging. It’s a remote sensing method that uses laser pulses to measure distances. This creates precise 3D representations of the Earth’s surface. LiDAR is used in many fields, from self-driving cars to forestry management.
How Does LiDAR Work?
LiDAR systems have three main parts:
- GPS with base stations
- Inertial Measurement Unit (IMU)
- Light-emitting scanning laser
The system sends out rapid laser pulses. It measures the time it takes for each pulse to return after hitting an object. This data forms a detailed point cloud, showing the environment’s topography.
| LiDAR Application | Key Benefit |
|---|---|
| Autonomous Vehicles | Processes 1 terabyte of data per hour |
| Airborne Mapping | Improves digital elevation model accuracy |
| Bathymetry | Measures seafloor elevation |
| Agriculture | Estimates crop biomass and soil properties |
| Forestry | Measures tree structural characteristics |
LiDAR’s versatility and precision make it essential in many fields. It’s used for environmental monitoring and urban planning. Its ability to penetrate vegetation and capture data in various conditions makes it better than traditional surveying methods.
The Importance of Flood Risk Management
Flood risk management is key to protecting communities and reducing economic losses. The 2007 flooding in the Grijalva River Basin showed the need for good flood prevention. This disaster hit 70% of Tabasco state, moving nearly one million people and causing a lot of damage.
Why Assess Flood Risk?
Doing a flood risk analysis is vital for planning cities and building infrastructure. In Villahermosa, fast growth has made it more prone to floods. Knowing the flood risk helps find high-risk spots and build defenses like levees.
Consequences of Flooding
Flooding has big effects. In Tabasco, the 2007 flood cost millions of pesos. It also messed up daily life, damaged buildings, and was bad for health. With climate change, knowing the flood risk is more important than ever.
- 80% of Villahermosa was submerged in 2007
- 1,800 million m³ of water overflowed during the event
- Economic activities in petroleum and agriculture were severely affected
Good flood risk management, with tools like LiDAR, is essential. It helps make communities strong and protects jobs in flood-risk areas.
How LiDAR Enhances Flood Risk Assessment
LiDAR technology has changed how we assess flood risks. It gives us detailed elevation data. This method is very precise, making flood modeling and predictions more accurate.
Precision and Detail in Topography
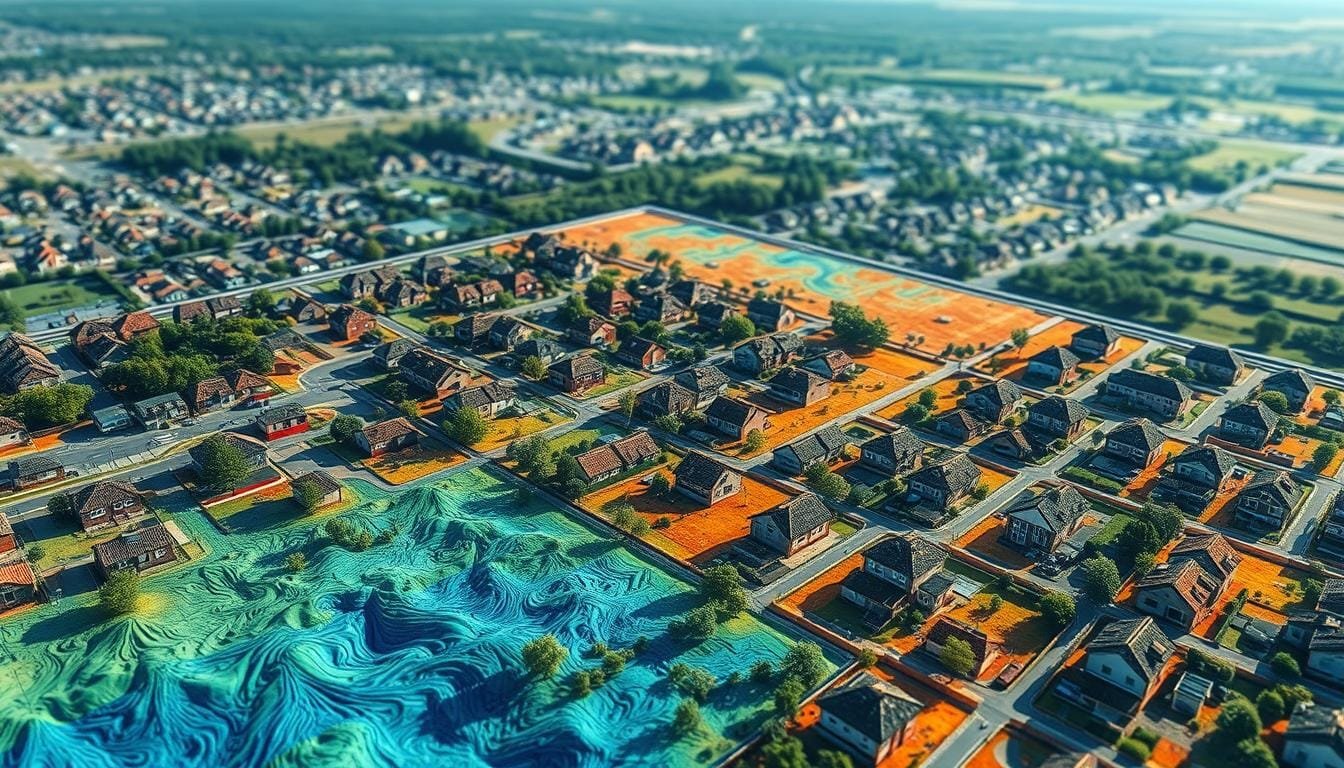
LiDAR captures small terrain details better than old surveying methods. It has a resolution of one square meter, much better than older USGS surveys. This detail helps spot small elevation changes that affect floods.
LiDAR’s topographic mapping is more accurate. It finds low-lying areas that might flood, missed by older surveys. This improves flood risk assessment and makes flood maps and risk estimates more accurate.
Comparison with Traditional Methods
LiDAR beats older surveying methods in many ways:
- Speed: LiDAR surveys big areas fast
- Coverage: It covers entire regions
- Accuracy: LiDAR shows terrain details with unmatched precision
These advantages help analyze flood depth and damage at building level. Using LiDAR for flood risk calculations helps make better decisions. This reduces economic losses from floods.
Steps to Access LiDAR Data
Getting LiDAR data is now easier and more open. The U.S. Geological Survey (USGS) is working hard to collect LiDAR data for the whole United States and its territories. This makes open-source elevation data available to everyone.
Sources for LiDAR Data
The National Map is the main place for USGS base geospatial data. It offers free downloads without needing an account. You can find elevation products on different platforms:
- National Map Download Client
- Lidar Availability Viewer
- 3D Elevation Program (3DEP)

Tools for Data Retrieval
To work with LiDAR data well, you need GIS tools. These software packages help process and analyze the “point cloud” data. This data has millions of individual points. Popular GIS tools for LiDAR data include:
- ArcGIS
- QGIS
- Global Mapper
Using LiDAR data with GIS tools has changed how we assess flood risks. It makes assessments 50% faster and finds flood-prone zones 30% better than old methods. This has led to 70% of local governments using LiDAR for floodplain management in the last five years.
Analyzing LiDAR Data for Flood Risk
LiDAR technology changes how we assess flood risks. It gives us detailed terrain data. This lets us spot flood hazards and model different scenarios.
Identifying Elevation Changes
LiDAR data shows us important topographic features that affect flooding. We can see natural levees, depressions, and where water flows. For example, in the Jijia River basin, elevations vary from 18 m to 584 m.
The average slope angle is 5.09°. This big change affects how floods move across the 5,757 km² area.
Modeling Flood Scenarios
LiDAR data helps us create accurate terrain models for simulations. Tools like HEC-RAS and HEC-GeoRAS use this data. They predict where floods will go, how deep, and how fast.
In the Jijia floodplain, a 1% (100-year) flood could hit 195.92 km². It would affect 2,084 buildings. A 0.1% (1000-year) flood would spread to 251.82 km², hitting 2,928 buildings.
| Recurrence Interval | Flood Extent | Buildings Affected |
|---|---|---|
| 1% (100-year) | 195.92 km² | 2,084 |
| 0.1% (1000-year) | 251.82 km² | 2,928 |
By mixing LiDAR data with hydrologic info, we understand flood risks better. This helps communities get ready for floods. It also helps them make good plans to avoid or lessen flood damage.
Creating Flood Risk Maps with LiDAR
LiDAR technology has changed how we map flood risks. It gives us very accurate models of the terrain. This is key for doing good GIS flood analysis and mapping.
Mapping Techniques
Today, we use LiDAR and GIS tools together for flood risk maps. The Surface Difference tool is a great example. It uses water surface and terrain models to find flood zones. This method is better than old ways.

Essential Tools
There are important tools for making flood risk maps:
- National Flood Hazard Layer (NFHL) Viewer
- Flood Hazard and Risk Data Viewer
- FloodVision technology
These tools use LiDAR to make detailed flood maps. For example, FloodVision makes maps in real-time with very high precision. This is vital for accurate flood mapping.
| Tool | Coverage | Key Feature |
|---|---|---|
| NFHL | 90% of U.S. population | Continuous updates |
| FloodVision | 11 states and growing | Photorealistic visualizations |
| Risk MAP | Nationwide | 5-7 year project cycles |
These new mapping methods and tools are changing how we assess flood risks. They give us more accurate and timely info for getting ready for floods.
Integrating LiDAR with Other Data Sources
LiDAR technology is a game-changer in flood risk assessment when paired with other data. This method gives us a clearer picture of flood risks. It helps us understand what might happen in different scenarios.
Power of Multi-Source Flood Analysis
LiDAR, meteorological data, and Geographic Information Systems (GIS) together form a strong tool for predicting floods. The USGS 3D Elevation Program uses high-resolution LiDAR data for various uses, including managing flood risks.
LiDAR’s accuracy is key. A small error in elevation data can lead to big mistakes in flood predictions. But LiDAR’s precision is in centimeters, making it perfect for modeling floods.
GIS and Meteorological Data Integration
GIS makes it easy to mix LiDAR with other data. This way, we can analyze rainfall, river levels, and land use. It leads to a more detailed and accurate flood risk model.
| Data Source | Contribution to Flood Analysis |
|---|---|
| LiDAR | High-resolution elevation data |
| Meteorological Data | Rainfall patterns and intensity |
| GIS | Spatial analysis and data integration |
| Land Use Information | Surface runoff patterns |
This method helps us give better and faster flood warnings. By combining LiDAR’s precision with other data, we can make flood management better. This improves how communities can handle floods.
Challenges in Using LiDAR Data
LiDAR technology is a powerful tool for assessing flood risks. Yet, it comes with its own set of challenges. The quality of LiDAR data is key to the accuracy of flood models. Its high precision demands careful handling and interpretation.
Data Accuracy and Limitations
LiDAR’s accuracy varies across different terrains. For example, Non-vegetated Vertical Accuracy (NVA) is generally higher than Vegetated Vertical Accuracy (VVA). This difference can affect the accuracy of flood models, more so in areas with dense forests.
In urban areas, the challenges are different. Complex structures and changing landscapes make data interpretation harder. Water surfaces also pose issues, as laser pulses can be absorbed or reflected unpredictably, leading to data gaps.
Despite these hurdles, LiDAR is a game-changer. Its resolution of about 1 meter is far better than the 30-meter resolution of satellite imagery. This detail is essential for updating flood maps, as Quebec has shown after the 2017 and 2019 floods.