Did you know 750 communities in Ohio depend on FEMA’s flood maps? Topographic maps are key in assessing flood risk. They offer vital elevation data, helping keep homes and communities safe.
Topographic maps show an area’s terrain, helping spot flood-prone zones. They help planners and emergency teams prepare for floods. These maps are essential for identifying risk areas based on rainfall and drainage.
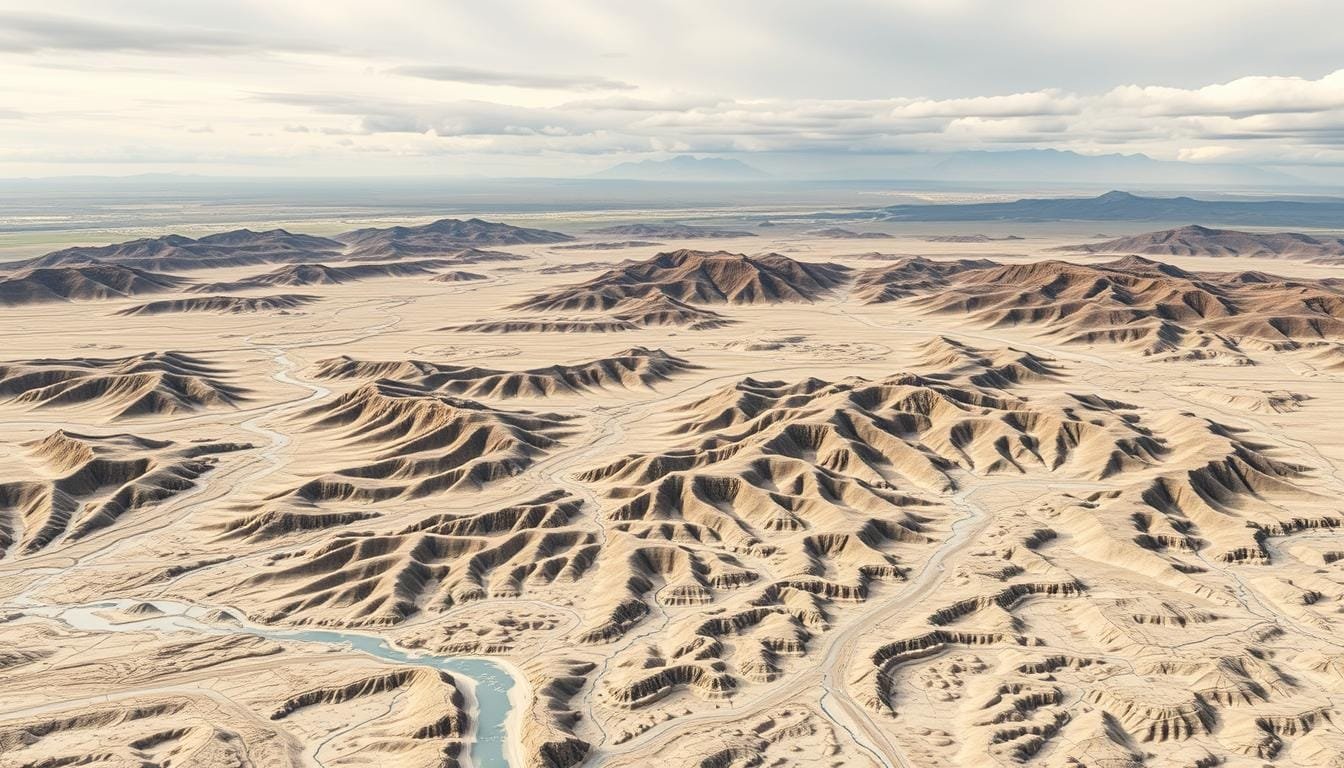
The link between topography and flooding is complex but vital. Low-lying areas, steep slopes, and water channels affect floodwater movement. Topographic maps help predict risk areas, protecting lives and property.
Exploring topographic maps and their role in flood risk is important. We’ll see how these tools help build safer communities. Stay tuned to learn how to use these maps for flood preparation.
What Are Topographic Maps?
Topographic maps are key for understanding land elevation and terrain. They use contour lines to show the landscape’s shape and height. These maps are vital for assessing flood risks, as they reveal important topography details.
Definition and Features
Topographic maps show both natural and man-made features. They use contour lines to represent the landscape’s three-dimensional shape on a flat surface. These maps also highlight rivers, lakes, forests, and buildings, giving a full view of the terrain.
Importance in Flood Risk Assessment
Topographic maps are essential for evaluating flood risks. They pinpoint low-lying areas likely to flood and show water flow paths. Studies have shown combining topographic data with hydrological info boosts flood risk predictions.
For accurate flood risk assessment, contour intervals should be 4 feet or less, or 2 feet in flat areas. This detail is critical for mapping Special Flood Hazard Areas (SFHAs) and determining Base Flood Elevations (BFEs). Experts use these maps to spot floodways and create detailed Flood Insurance Rate Maps (FIRMs).
Understanding Flood Risk
Floods can happen anywhere, not just near water. Heavy rains, bad drainage, and construction can increase risk. To really understand flood risk, we need to look at different factors and how they work together.
Factors Influencing Flood Risk
Many things affect an area’s flood risk. These include rain patterns, soil types, land use, and the shape of the land. Each one is important in figuring out how water moves and piles up during heavy rains.
- Rainfall intensity and duration
- Soil saturation and permeability
- Urban development and impervious surfaces
- Natural and man-made drainage systems
The Role of Topography in Flooding
Topography is key in finding flood-prone areas. It determines how water moves over the land, affecting drainage and flood paths. By analyzing watersheds, we can see where water tends to collect and flow, helping us predict flood risks.

Areas low to the ground and floodplains are very likely to flood. Steep slopes can make water flow fast, while flat areas can hold water. Knowing these land features is vital for managing flood risks.
| Topographic Feature | Impact on Flood Risk |
|---|---|
| Floodplains | High risk of inundation |
| Steep slopes | Rapid water runoff |
| Valleys | Water accumulation points |
| Ridges | Natural flood barriers |
Types of Topographic Maps
Topographic maps come in different types, each helping with flood risk assessment. They are key to understanding terrain and flood zones.
Contour Maps
Contour maps are a classic type. They show areas of equal elevation with lines. Each line is a specific height above sea level.
Close lines mean steep slopes. Wide lines show flat areas. USGS maps use this format, helping with initial flood risk checks.
Digital Elevation Models
Digital Elevation Models (DEMs) are more advanced. They use 3D terrain models from LiDAR data. LiDAR sends laser pulses to measure distances, creating accurate elevation data.

DEMs give detailed land surface info, essential for flood risk assessment. They show elevation changes not seen on contour maps. This detail helps in more accurate flood modeling and risk prediction.
| Map Type | Technology | Accuracy | Use in Flood Risk Assessment |
|---|---|---|---|
| Contour Maps | Traditional surveying | Moderate | Initial evaluations, large-scale assessments |
| Digital Elevation Models | LiDAR, satellite imagery | High | Detailed flood modeling, precise risk prediction |
Both map types are vital for flood risk assessment. Contour maps give a broad view. DEMs provide the detailed data needed for thorough flood risk analysis and planning.
How Topographic Maps Help Assess Flood Risk
Topographic maps are key in figuring out flood risks. They show an area’s terrain, helping experts spot flood-prone zones and check drainage. This info is key for making good flood plain mapping and flood management plans.
Identifying High-Risk Areas
Topographic maps are vital for finding areas likely to flood. They look at elevation and slope to spot low-lying spots and water accumulation zones. This info helps match up with FEMA’s flood maps, which check flood risk and damage based on asset value and flood depth.
Evaluating Drainage Patterns
Knowing how water flows is key to predicting floods. Topographic maps show water’s natural paths, helping with runoff analysis. This is very useful in cities where buildings can change how water flows.
| Feature | Importance in Flood Risk Assessment |
|---|---|
| Elevation Data | Identifies low-lying areas prone to flooding |
| Slope Gradients | Indicates possible water flow directions |
| Drainage Patterns | Helps predict where water will gather |
By mixing topographic data with other flood risk factors, experts can make more precise flood risk assessments. This helps in getting ready for and managing floods, protecting lives and property in flood-risk areas.
Interpreting Topographic Features
Understanding topographic features is key to assessing flood vulnerability. This section explores how to read elevation data and identify key landscape elements that affect water flow.
Understanding Elevation and Slope
Elevation data on topographic maps shows the terrain’s height above sea level. Closely spaced contour lines mean steep slopes. Wider spacing means flatter areas.
Slope analysis helps predict water runoff patterns. Steep slopes lead to rapid water movement. This increases flood risk in lower areas.
Recognizing Watersheds and Valleys
Watersheds, or catchment areas, are where water collects and drains to a common point. Identifying these areas on topographic maps is key for predicting flood paths. Valleys, marked by V-shaped contour lines pointing upstream, are natural water channels and possible flood zones.
To assess flood vulnerability effectively, combine topographic analysis with other data like soil types and land use. For example, areas with soil group “C” in the Cedar River basin have higher runoff. This increases flood risk. Understanding these features helps create more accurate flood risk assessments and guides mitigation efforts.
Best Practices for Using Topographic Maps
Topographic maps are great for checking flood risk. To get the most out of them, use them with other data. This makes flood modeling better and helps in reducing risks.
Combining Maps with Other Data
Using topographic maps with FEMA’s flood data gives a full picture of flood risks. The FEMA Risk MAP Program has rules for flood risk analysis and mapping. By adding topographic info to FEMA’s digital Flood Insurance Rate Maps (FIRMs), you can spot high-risk spots better.
GIS is important here. It helps mix topographic data with other key info like soil types, land use, and past flood data. Adding the national Risk Analysis Census Block Group dataset, with details like population and flood claims, makes risk assessments more accurate.
Using advanced flood modeling with this mix is beneficial. For example, the Floodplain Boundary Standards (FBS) have rules for accuracy based on population density. Areas with lots of people need 95% +/- 1.0 foot accuracy. Using these standards in your modeling makes risk assessments more precise.